Customer success teams are responsible for helping customers derive the maximum value from a product or service. To do that, they have to monitor customer data and touchpoints, such as the customer onboarding process, product adoption, time-to-value, product usage, customer retention, and customer churn, among other things.
All of this data is neatly displayed on a customer success dashboard. This dashboard converts raw data into meaningful insights that customer success teams can use to gauge the performance of their strategies and pinpoint what to improve upon.
In this article, we’ll explore what a customer success dashboard is, why it’s important, how to use customer success dashboard templates, and some tools for creating a dashboard.
Skip ahead:
- What is a Customer Success Dashboard?
- Why Use a Dashboard Template?
- Key Features of an Effective Dashboard
- Step-by-Step Guide to Using a Dashboard Template
- Tools and Resources for Creating Your Dashboard
- Save time and resources with customer success dashboard templates
- FAQ


In today’s data-driven world, customer success is as much about insights as it is about service. To build long-lasting customer relationships, customer success teams need access to real-time data, spanning everything from customer satisfaction to engagement with products, services and educational resources. With a well-designed customer success dashboard, your teams can visualize this data at a glance, making it easier to track key metrics, identify trends, and respond proactively to customer needs.
Platforms like Thinkific Plus add another layer to this equation by enabling your customer success team to integrate critical customer education data within their customer success dashboards. Tracking customer education and success metrics allows your team to understand how well customers are learning about your products and services, spotting opportunities to improve satisfaction, reduce churn, and encourage product adoption.
In this blog post, we’ll cover the essentials of customer success dashboards, why templates can simplify the process for your team, key features to look for, and advanced steps for creating a robust dashboard tailored to your organization’s goals.
By the end, you’ll be equipped with actionable tips and resources to build a dashboard that supports every stage of the customer journey. Let’s dive in.
What is a customer success dashboard?
A customer success dashboard is a visual tool that gives your team a comprehensive view of the key customer success metrics they’re tracking to monitor customer health, satisfaction, and engagement. By converting raw data into meaningful insights, this dashboard helps ensure that your customers are experiencing the full value of your product or service.
A well-designed customer success dashboard includes metrics that allow your team to:
- Monitor customer satisfaction and loyalty (For example: CSAT and NPS scores)
- Identify customers who are at risk of churning
- Track product usage trends
- Forecast renewals and opportunities for upsells and cross-sells
Key metrics often featured on a customer success dashboard include:
- Customer satisfaction score (CSAT)
- Net promoter score (NPS)
- Customer lifetime value (CLV)
- Customer retention rate
- Churn rate
- Customer health score
- Customer support ticket trends
- Usage analytics
- Upsell and cross-sell opportunities
- Renewal forecast
In B2B settings, these metrics can be analyzed across customer segments, based on characteristics like industry, location, or organization type. This segmentation helps you tailor success strategies to each customer group and even provides insights that marketing can use to personalize outreach.
With a customer success dashboard by your side, your team has a powerful tool to track what matters most, helping you build long-term relationships that drive customer retention and growth.
Learn more: Why Customer Segmentation Matters (And How To Do It Right)
Why use a customer success dashboard template?
While it’s possible to create a customer success dashboard from scratch, using a customizable template can save your team time, reduce costs, and offer a streamlined approach to tracking critical customer metrics.
Here are 5 key reasons why dashboard templates are a smart choice:
- Saves time: With a ready-made structure, a dashboard template enables your team to jump straight into tracking customer success metrics without needing to build from the ground up. The time saved can be invested into refining customer strategies or acting on the data insights the dashboard provides.
- Stays current with best practices: Many templates are built to include industry-standard metrics and KPIs, ensuring your dashboard reflects essential customer success indicators without guesswork.
- Customizable for your needs: Pre-made templates often offer flexibility to adjust layouts, add or remove metrics, and personalize data views. This means your team can tailor dashboards to align with specific business goals and departmental needs.
- Facilitates cross-functional collaboration: Templates provide a standardized way for departments to view customer success data, fostering collaboration across teams. By sharing insights from a single source of truth, your sales, marketing, and product teams can work together to create a more cohesive customer experience.
- Supports benchmarking: Some dashboard templates come with built-in benchmarking capabilities, allowing your team to compare your customer success metrics against industry standards or competitors. This context helps you understand how your customer success efforts measure up and where you might focus improvements.
By using a customer success dashboard template, you can provide your team with a head start in tracking customer health and engagement, setting them up for greater agility, transparency, and data-driven customer success.
Types of customer success dashboards
Customer success dashboards can vary based on the metrics you prioritize and the tools and technology your organization uses to track them.
Here are a few common types of dashboards that support different facets of customer success, each providing unique insights to help you deliver better outcomes.
1. Product usage dashboard
A product usage dashboard monitors customer engagement with your product’s features and tracks how actively your customers are interacting with your platform.
This type of dashboard helps your product team identify which features are popular amongst your customer base, which may need improvement, and where customers might need additional support or education to maximize their use of your product.
- Key metrics: Feature adoption rates, usage frequency, and time spent on specific features.
- Goal: Understand customer behavior, encourage usage of high-value features, and identify opportunities for upselling.
2. Support dashboard
A support dashboard displays metrics related to customer support interactions, giving you insight into common issues, support ticket volume, and overall quality of customer service.
Tracking key support metrics can help your team address frequently asked questions proactively and optimize your service process to improve customer satisfaction.
- Key metrics: Ticket volume, response and resolution times, and customer satisfaction with support interactions.
- Goal: Reduce ticket backlog, improve response times, and enhance the customer support experience.
3. Customer training dashboard (LMS)
A customer training dashboard, often part of a Learning Management System (LMS), allows you to track customer engagement with customer education content.
This type of dashboard gives you a clear view of how customers are progressing through your training programs, which helps you assess their understanding and adoption of your product. By monitoring key customer educstion metrics such as course completions, quiz results, and engagement with educational resources, your team can gauge how well customers are mastering your product, reducing their likelihood to churn and increasing long-term satisfaction.
- Key metrics: Course completion rates, learner progress, engagement with resources, and assessment scores
- Goal: Ensure customers are well-trained, confident in product use, and able to derive maximum value independently.
Platforms like Thinkific Plus offer advanced analytics for tracking customer learning within the LMS platform. This data can be integrated into your customer success dashboard, helping your team monitor customer progress, understand training impact, and even automate reports on customer education performance.
4. Renewal and expansion dashboard
A renewal and expansion dashboard helps your customer success team forecast customer renewals, track upsell and cross-sell opportunities, and monitor factors that influence customer retention. This type of dashboard is especially useful for understanding customer lifetime value (CLV) and identifying customers who may benefit from additional products or services.
- Key metrics: Renewal rates, upsell and cross-sell revenue, customer lifetime value (CLV), an d expansion opportunities.
- Goal: Maximize customer lifetime value by identifying and acting on growth opportunities within the customer base.
With these customer success dashboards as part of your toolkit, your team can dive deep into monitoring specific aspects of customer success and adjust your strategies accordingly for more impactful results.
Integrating data from multiple dashboards across the organization such as the ones we shared above (product usage and customer training for example), can provide a holistic view that supports your team in building stronger, long-lasting customer relationships.
Key features of an effective dashboard
If you’re planning to use a customer success dashboard template, it’s essential to choose one with features that make it both impactful and easy to use.
Here are some key features to consider:
- User-friendly interface: An effective dashboard template should have a well-designed, intuitive interface that allows your team to navigate and understand information easily. A clear layout with structured visuals helps your team make faster, data-driven decisions.
- Real-time data: The ability to display real-time or near-real-time data ensures that your dashboard reflects the most current customer metrics, enabling timely and relevant decision-making. Up-to-date insights are especially valuable for responding to customer needs quickly and proactively.
- Customization options: Your business needs may evolve, and so should your dashboard. Look for a template that is customizable and allows you to add or remove metrics, rearrange layout elements, and tailor data views according to your team’s changing priorities and objectives.
- Comprehensive metrics: The ideal dashboard template includes a range of metrics covering customer satisfaction, product usage, support interactions, and educational engagement. A comprehensive approach ensures that your team has a full picture of customer health, engagement, and needs.
- Visualizations: Clear and compelling visualizations, such as charts and graphs, make complex data more digestible at a glance. Look for templates with multiple visualization options that allow you to display metrics in a way that enhances readability and insight.
- Drill-down capability: A powerful dashboard offers drill-down functionality, allowing your team to explore specific metrics or customer segments in greater detail. This capability helps you find root causes of issues and better understand specific customer groups or behaviors.
- Customer segmentation: Your dashboard should enable you to segment customers based on criteria that matter most to your business, such as demographics, behaviors, or firmographic details. This segmentation helps your team tailor success strategies to different groups and identify patterns that inform customer outreach.
- Integration with CRM and other systems: Choose a dashboard that can integrate with your CRM, customer training platforms, and other data sources. By consolidating information such as product usage and training metrics from platforms like Thinkific Plus, you’ll get a holistic view of the customer experience and optimize cross-functional collaboration.
- Scalability: As your customer base grows, so will your data needs. An effective dashboard template should be scalable, capable of handling increasing data volume and accommodating expanding user requirements.
With these key features, your customer success dashboard will provide actionable insights that allow your team to monitor customer health, track engagement, and support customer success initiatives at every level.
Enhancing your customer success dashboard by integrating data from multiple tools
A comprehensive customer success dashboard becomes even more powerful when it incorporates data from multiple tools and technology across your organization. Integrating data from various sources, such as your Customer Relationship Management Software (CRM), customer education platforms, and product usage analytics can allow your team to create a unified view of your customer engagement and success.
Here’s how to enhance your customer success dashboard by working with your data team to merge insights from different platforms:
1. Collaborate with your data team for seamless integration
- Establish key metrics and sources: Begin by identifying the metrics you want to track and mapping out the data sources where this information resides by taking inventory of your tech stack and tools. Your data team can help you connect data from customer success platforms, support software, product analytics, and LMS systems.
- Streamline data feeds: Work with your data team to automate data feeds, so metrics are updated in real time or at regular intervals. This reduces manual data entry and ensures accuracy, giving your team reliable insights without the need for constant updates.
2. Unify data from customer education platforms
- Incorporated training data: Integrating data from your customer education platform enables you and your team to track training metrics alongside key customer success indicators. By bringing in metrics such as course completion rates, learner progress, and assessment scores, your customer success dashboard can provide a clear picture of how well your customers are learning your product.
- Advanced analytics: Look for platforms like Thinkific Plus that offer advanced analytics that allow you to automate reports and view trends in customer education. You can integrate this data into your customer success dashboard, giving you insights into how training impacts customer satisfaction, usage, and retention. Streamline your workflows by working with your team on consolidating key metrics, making it easier to measure and act on educational engagement data within the broader customer success framework.
3. Implement automated reporting and alerts
- Set up key alerts: Configure alerts and notifications within your dashboard for important changes or metrics. For example, you might want to consider setting alerts for upcoming renewals, shifts in customer health scores, or completion of critical training modules. These alerts can keep your team informed of any trends or issues that may require immediate attention.
- Automate periodic reports: Automating reports allows you to review customer success performance at regular intervals without manually extracting data. With platforms like Thinkific Plus, you can automate progress reports on your customer education analytics, so your team always has a current snapshot of how customer training programs are impacting customer success.
4. Leverage data visualization for cross-functional insights
- Build interactive visuals for team collaboration: Use interactive visuals to combine data from customer support, product usage, and training. Interactive charts and graphs help your team see correlations across departments, such as how training completion correlates with product adoption, or how support ticket resolution times impact customer satisfaction.
- Foster data-driven collaboration: By sharing a dashboard that includes data from all of your relevant customer success tools, your customer success, product, and marketing teams can work from a single source of truth. This shared understanding helps teams align strategies, improve the customer journey, and support long-term retention.
By integrating data from various sources into your customer success dashboard, you can create a comprehensive view that supports informed, timely decisions across departments.
Platforms like Thinkific Plus can simplify this process with advanced analytics and automation, enabling your team to maintain an up-to-date, impactful customer success dashboard.
Step-by-step guide to using a dashboard template
Crafting your customer success dashboard can seem daunting at first, but not to worry. Following a step-by step approach can help your team craft an efficient customer success dashboard template that is customizable to suit your needs:
1. Define your objectives and key metrics
- Clarify your goals: Start by defining the primary objectives for your customer success dashboard. For example, are you looking to improve customer retention, monitor satisfaction, or track onboarding success?
- Identify essential metrics: Select the specific metrics that align with your goals, such as NPS, churn rate, or course completion rates from your customer training platform. Prioritizing key metrics will help ensure that your dashboard provides meaningful, actionable insights.
2. Choose the right template
- Select a relevant template: Look for a pre-built template that matches your business goals and includes metrics relevant to customer success. Many business intelligence tools, such as Tableau, Power BI, or Google Data Studio, offer templates that you can customize.
- Focus on customization: Choose a template that allows flexibility so you can add or adjust metrics as your needs evolve.
3. Gather data sources and connect them
- Map out data sources: Identify the systems where your customer success data resides, such as CRM software, product analytics, support ticket systems, or an LMS like Thinkific Plus.
- Integrate data sources: Work with your data team to connect these sources to your dashboard tool. Ensure that data flows accurately and, if possible, update in real time or at regular intervals to keep metrics current.
4. Customize the dashboard layout
- Organize for clarity: Arrange the metrics in a logical, easy-to-follow order. Group related metrics together to create a cohesive story, such as displaying all customer satisfaction metrics in one section and product usage metrics in another.
- Highlight key insights: Make sure the most important metrics, like customer health scores or customer training completion rates, are prominently displayed. This arrangement can help ensure that the dashboard highlights actionable insights at a glance.
5. Configure data visualization widgets
- Select visualizations carefully: Choose the visualization type—charts, graphs, or heat maps—that best represents each metric. Use bar graphs for tracking changes over time, pie charts for distribution, or line charts for trends.
- Customize each widget: Adjust each widget to display the relevant metrics, such as:
- A customer health score widget that aggregates multiple data points to provide an overall customer health view.
- A product adoption chart to illustrate feature usage trends.
- A customer training progress widget for tracking customer engagement with customer education resources.
6. Add filters and interactivity
- Enable filtering options: Add filters that allow your team to narrow down insights by specific time periods, customer segments, or product features. This functionality lets users customize the data view based on their needs.
- Interactive drill-downs: Set up interactive drill-down capabilities so team members can click on a specific metric, such as NPS or product usage, and view deeper insights into individual customer segments or behaviors.
7. Set up alerts and notifications
- Configure real-time alerts: Set up alerts for key events, such as a sudden drop in customer satisfaction scores or an increase in support ticket volume. Alerts keep your team proactive, allowing them to address issues as soon as they arise.
- Automate notifications for training milestones: If you’re using an LMS Thinkific Plus, configure automated notifications for key training events, such as course completions or low engagement to help your team monitor the effectiveness of customer education.
8. Test the dashboard
- Conduct a comprehensive review: Before rolling out the dashboard to your team, thoroughly test it for accuracy and functionality. Ensure that metrics are displayed correctly, visualizations are clear, and interactive features function as expected.
- Gather feedback from test users: Share the dashboard with a small group of test users, such as members of yourcustomer success or product team and collect feedback. This allows you to identify any usability issues and make adjustments before full deployment.
9. Monitor and iterate
- Collect ongoing feedback: Regularly check in with dashboard users and stakeholders to gather feedback. As your business evolves, so will your dashboard needs, so staying open to improvement is essential.
- Update as needed: Periodically review the dashboard to ensure it aligns with current business goals, and make updates as your customer success strategy develops. Consider adding new metrics or adjusting visualizations to keep your insights fresh and relevant.
By following these steps, you’ll be able to create a customized, insightful customer success dashboard that empowers your team to act on data and support your customers more effectively.
Tools and Resources for Creating Your Dashboard
Creating an effective customer success dashboard requires choosing the right platform or tool that aligns with your business needs.
Here are some popular tools for building and enhancing your customer success dashboard, each offering unique features to support different aspects of customer success.
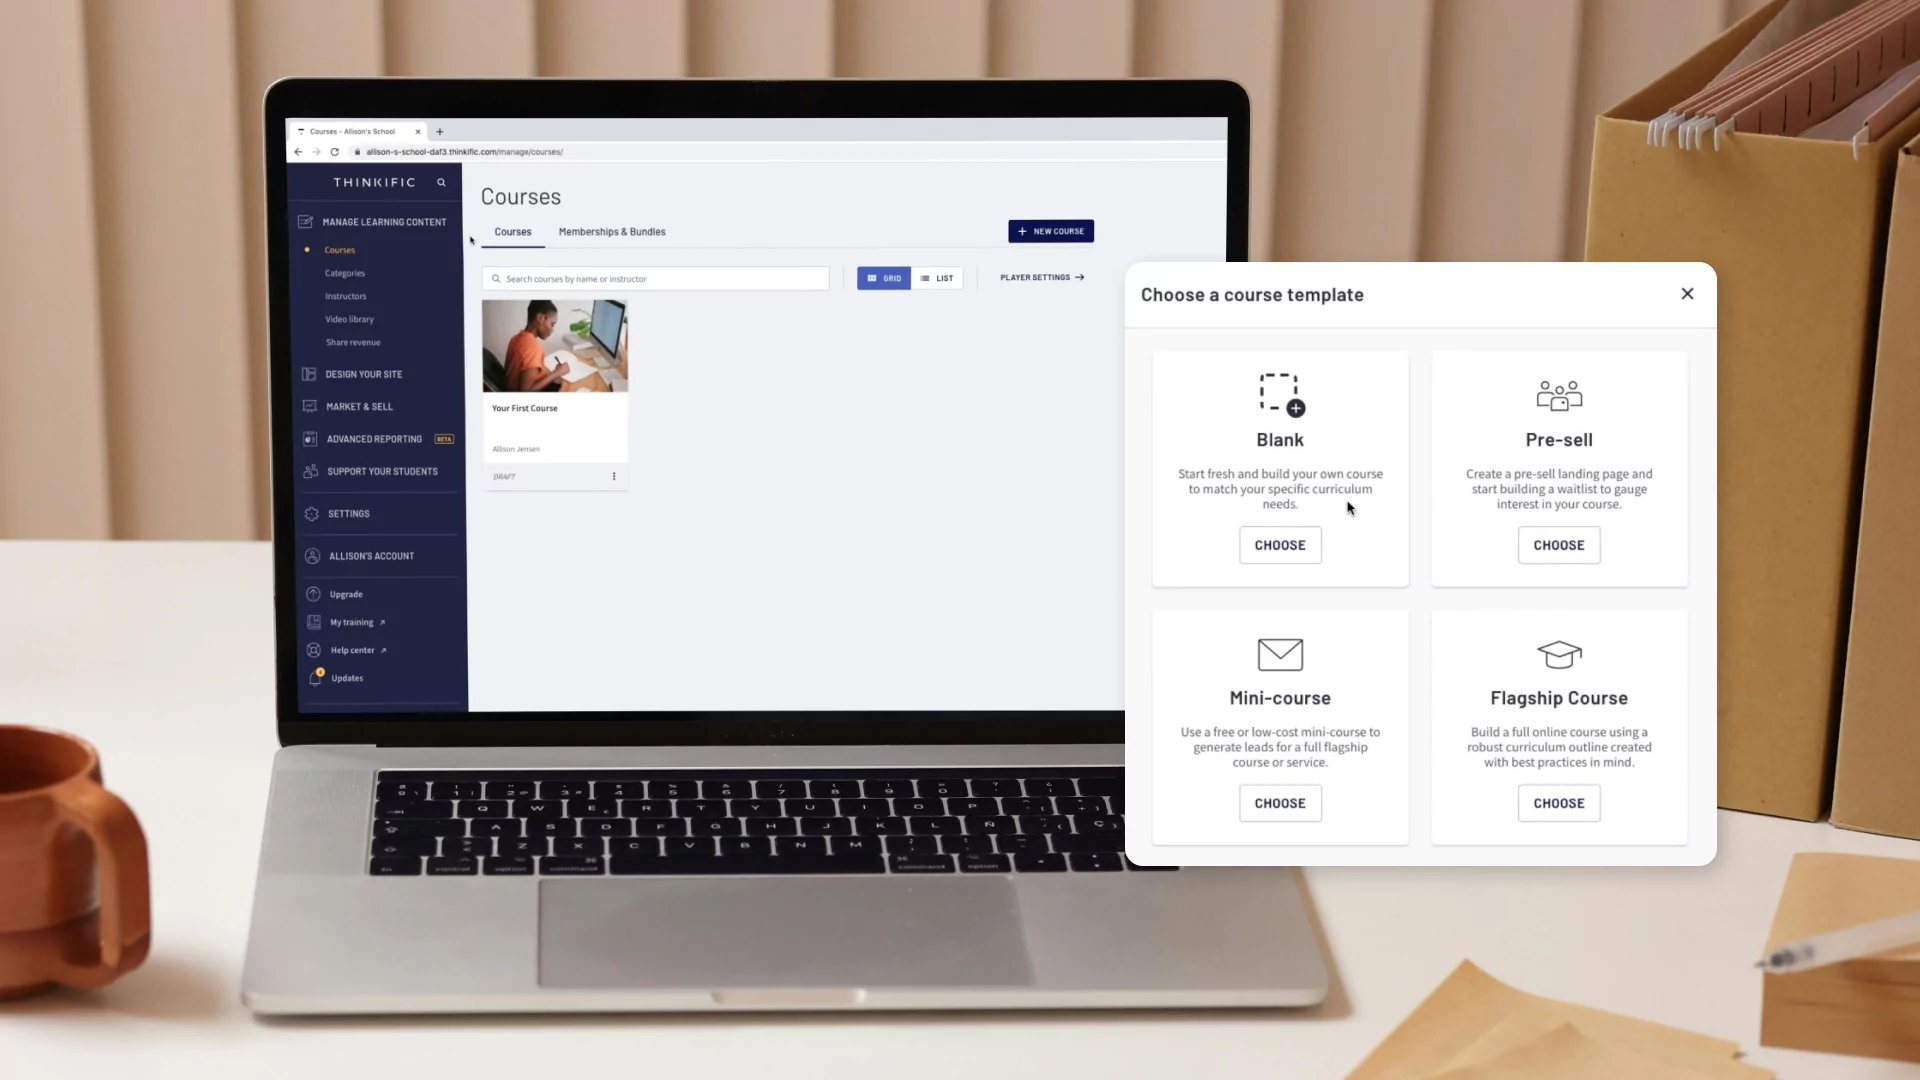
- Thinkific Plus
Tableau

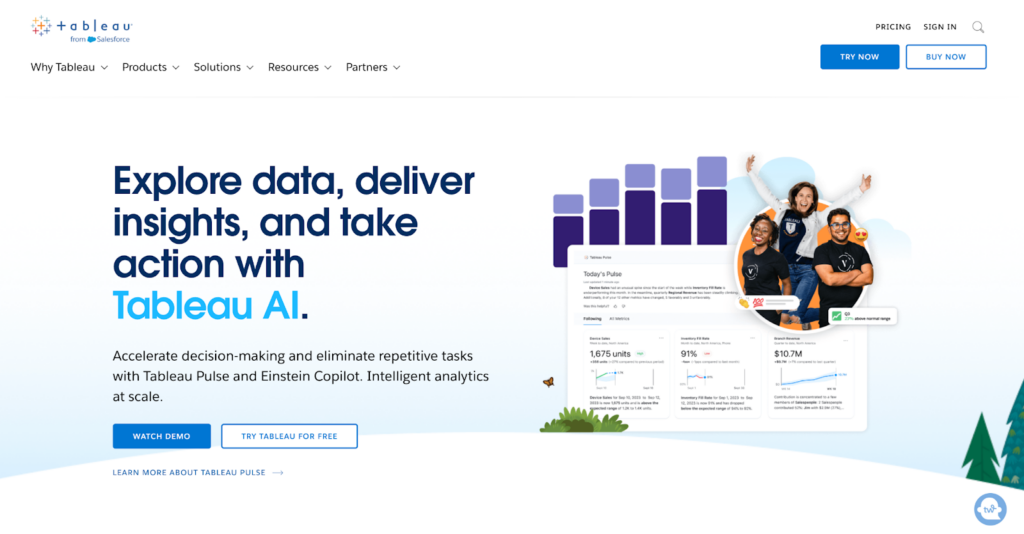

Tableau is a leading business intelligence and data visualization platform that enables organizations to turn raw data into meaningful insights through interactive and visually compelling dashboards.
Known for its user-friendly interface and robust functionality, Tableau allows you to connect to various data sources, including databases, spreadsheets, and cloud-based platforms, and create dynamic visualizations without requiring extensive programming skills.
Tableau supports drag-and-drop functionality, enabling you to design dashboards that can be easily shared across teams and organizations. The platform’s versatility extends to areas such as finance, marketing, operations, and customer success, making it a great tool for professionals in just about any industry.
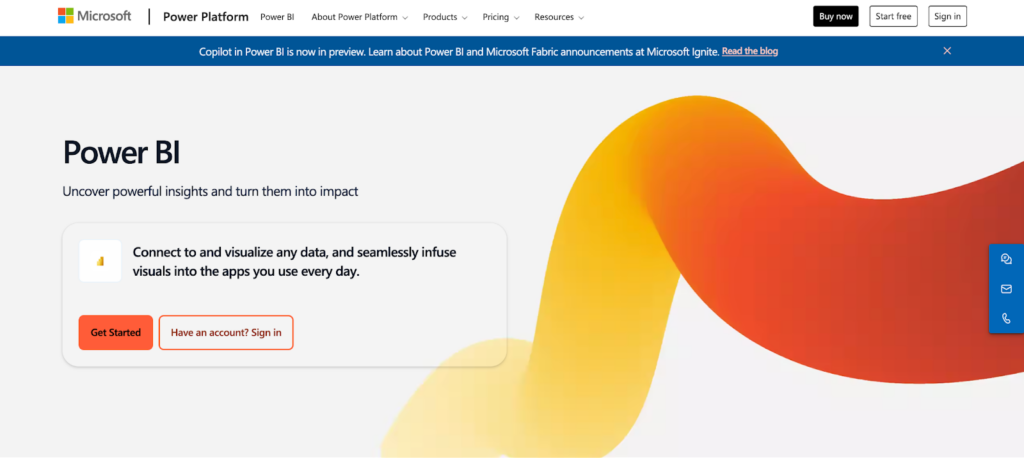

Microsoft Power BI is a suite of business analytics tools designed to help businesses create interactive dashboards and share insights across the organization. Integrated seamlessly with the Microsoft ecosystem, Power BI allows you to connect to a myriad of data sources, including databases, Excel spreadsheets, cloud services, and streaming data.
With an intuitive drag-and-drop interface, you can design interactive reports and dashboards, and Power BI’s natural language processing feature allows you to pose questions in plain language and receive relevant visualizations in response.
Businesses use Power BI for data exploration and analysis, and to uncover patterns, trends, and outliers within their datasets. This tool facilitates self-service analytics, empowering non-technical users to create and explore data visualizations without relying on IT support. It also supports collaboration by allowing you to share dashboards and reports with colleagues and stakeholders.
Google Data Studio
Google Data Studio is a free and cloud-based tool that allows you to create interactive and customizable dashboards and reports. Integrated with various Google products such as Google Analytics, Google Ads, and Google Sheets, Data Studio allows you to connect to diverse data sources, as well as third-party platforms through connectors.
This platform is known for its collaborative features, allowing multiple users to work on a report simultaneously and share the final product through a simple URL. It also supports real-time data updates, allowing you to monitor changes and trends as they happen.
The uses of Google Data Studio span across different industries. For example, marketers use it to create comprehensive reports that consolidate data from different marketing channels, providing insights into campaign performance, audience behavior, and conversion rates.
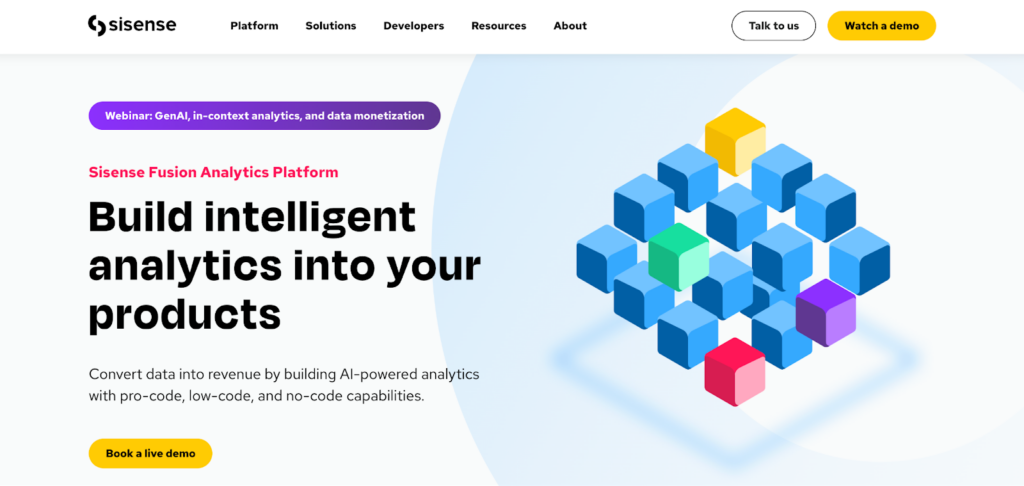

Sisense is a robust business intelligence platform designed to simplify complex data analysis and visualization.
Known for its ease of use and powerful capabilities, Sisense enables users to consolidate and analyze large volumes of data from various sources, offering a single, unified view. Its unique In-Chip technology allows for fast data processing, ensuring quick and efficient querying of extensive datasets.
Businesses use Sisense to explore and analyze data, monitor KPIs, track operational efficiency, gain a better understanding of their data landscape, and derive actionable insights from diverse datasets.
As we wrap up this article, remember that selecting the right tool for your dashboard needs depends on your business requirements, available data sources, and the specific metrics you wish to monitor.
Save time and resources with customer success dashboard templates
A customer success dashboard helps your team track essential metrics and make data-driven decisions, but creating one from scratch can be time-intensive and costly—especially for fast-growing businesses or startups with limited resources.
That’s where customer success dashboard templates come in, providing a ready-made structure that allows you to start tracking customer insights quickly and efficiently.
Here’s a recap of how customer success dashboard templates can benefit your team:
- Faster setup: Dashboard templates provide a foundational layout, so your team can skip the design phase and begin visualizing critical metrics right away. This streamlined setup saves hours, allowing your team to focus on acting on insights rather than configuring the dashboard.
- Cost savings: Pre-made dashboard templates are a budget-friendly alternative to custom-built solutions. For businesses with limited resources, templates reduce the costs associated with designing and developing a dashboard from the ground up.
- Optimized for industry standards: Many dashboard templates come pre-loaded with the metrics that matter most in customer success, such as NPS, churn rate, and CSAT. They also incorporate best practices for data visualization, ensuring that your dashboard reflects key insights without needing extensive customization.
- Facilitates proactive decision-making: With a ready-to-use dashboard template, your team can track customer success metrics in real-time, identify trends quickly, and address potential issues before they escalate. This proactive approach is especially valuable for supporting high-growth goals.
Using customer success dashboard templates can give your team a head start in monitoring customer health, engagement, and satisfaction—without the complexity of designing a dashboard from scratch.
FAQ
- What are the key metrics for a customer success dashboard?
The most valuable metrics for a customer success dashboard often include:- Customer satisfaction score (CSAT): Measures customer happiness with a specific interaction or experience.
- Net promoter score (NPS): Gauges customer loyalty and likelihood to recommend your product.
- Customer retention rate: Indicates the percentage of customers who continue to use your product over time.
- Customer lifetime value (CLV): Represents the total revenue generated from a customer over the course of their relationship with your business.
- Churn rate: Shows the rate at which customers stop using your product.
- Product usage metrics: Tracks engagement with key features or functions.
- Customer education metrics: For example, Thinkific Plus lets you track training completion rates and learner engagement, providing a view into how customer education supports satisfaction and retention.
- How often should a customer success dashboard be updated?
The ideal update frequency depends on your industry, customer interaction level, and the need for real-time insights. In fast-paced environments where customer behavior changes quickly, real-time or daily updates may be beneficial. For businesses with more stable customer interactions, weekly or monthly updates may suffice. Platforms like Thinkific Plus offer automated reporting, ensuring customer training metrics remain current without manual intervention. - What are the common mistakes to avoid in dashboard design?
When creating a customer success dashboard, it’s best to avoid these common pitfalls:- Overloading with data: Displaying too many metrics can overwhelm users. Focus on the KPIs that align directly with your goals.
- Confusing layout: Organize the dashboard logically, with similar metrics grouped together to create a cohesive story.
- Inconsistent visuals: Use consistent chart types for similar metrics to improve readability.
- Ignoring audience needs: Design with your users in mind, ensuring they can access the insights they need easily.
- Neglecting mobile responsiveness: Make sure your dashboard is accessible on mobile devices, especially for team members on the go.
- How can integrating customer education metrics enhance my dashboard?
Integrating customer education data, such as course completion rates and engagement metrics, provides a holistic view of how well customers understand and adopt your product. Platforms like Thinkific Plus offer advanced analytics for customer training, giving you actionable insights that show the impact of education on satisfaction, usage, and retention. This data allows you to identify gaps in knowledge, support customers proactively, and build a more empowered, loyal customer base. - Are there resources available to help me implement customer success dashboard templates?
Yes! Many platforms offer pre-built templates for customer success metrics, while Thinkific Plus provides customizable templates designed specifically for customer education data. By leveraging these resources, your team can integrate training metrics into your dashboard and ensure a complete view of customer engagement and success.
Start driving customer success today.
For organizations looking to enhance their customer education insights, platforms like Thinkific Plus make it possible to integrate your customer education data with your tech stack, and customer dashboard.
With advanced analytics and customizable templates helping you track learner progress, measure satisfaction, and streamline reporting—so your team can focus on driving impactful results.
Want to see Thinkific Plus in action? Request a demo today to discover how Thinkific Plus can empower your customer success team with the insights they need to foster long-term customer loyalty and success.